Data Exploration and Prediction Project
EXPLORING THE NYC DEPARTMENT OF CONSUMER AFFAIRS INSPECTIONS DATA SET
The NYC Department of Consumer Affairs serves many roles. One of their chief roles is that of licensing over 81,000 businesses in about 55 different industries. In addition to licensing the businesses, the DCWP also inspects these businesses to ensure that they are in compliant with the existing NYC laws that govern the industries they license. The DCWP makes their inspection data available to the public via NYC Open Data portlet and can be accessed by clicking the link below:
Department of Consumer Affairs (DCA) Inspections
The purpose of this project was to explore a large data set and make some predictions as to how many total inspections we should see at the end of the year.
Business Questions
My first initial business questions consisted of descriptive questions that would easily be answered through exploring the data. Among these questions were, what Borough gets inspected the most? Is there a day of the week where inspections occur at a larger volume? Are some months busier than others? I also wanted to explore patterns with regards to the day and time of inspections to see if there was any relation with the inspections and violations. Although the entry system logs the hours of the inspections (I know because it is a required field), it some how did not make its way into the dataset and I was unfortunately unable to explore time of day. I alter discovered what looked like a significant decrease in the number of inspections occurring. I wanted to see if DCA was on track to conduct the same number of inspections as they have done in the previous year.
Import Libraries & Data
Lets import the packages we will be using:
# Install Libraries
from sodapy import Socrata # pip install sodapy
import os
import requests
import csv
import pandas as pd
import numpy as np
from pandas.api.types import CategoricalDtype
from plotnine import * # pip install plotnine
from plotnine import ggplot, geom_point, aes, stat_smooth, facet_wrap
import folium
import webbrowser
import matplotlib.pyplot as plt
plt.style.use('ggplot')
%matplotlib inline
import warnings
warnings.simplefilter('ignore')
Next I imported the data using the Socrata API. This code was supplied by Socrata. I set the limit to 1 million entires as I wanted a large amount of data. At the time of running this code, the dataset consisted of 196,342 rows and 18 columns. The data set is rountinely updated so this will vary depending on when you run the code. I also took a look at the head end of the dataframe
import warnings
warnings.simplefilter('ignore')

# Load the API and file with the API supplied by Socrata

client = Socrata("data.cityofnewyork.us", None)
inspectionresults = client.get("jzhd-m6uv", limit=1000000)
infile = inspectionresults

# Convert to pandas DataFrame
inspections_df = pd.DataFrame.from_records(inspectionresults)

# Display results
nrows = len(inspections_df)
size = inspections_df.size
ncols = int(size/nrows)
print("*"*80)
print ("You loaded a total of", nrows, "records into your dataframe.")
print ("You have", nrows, "rows and", ncols ,"columns. Total data points is", size)
print("*"*80)
inspections_df.head(5)
********************************************************************************
You loaded a total of 196342 records into your dataframe.
You have 196342 rows and 18 columns. Total data points is 3534156
********************************************************************************
| record_id | certificate_number | business_name | inspection_date | inspection_result | industry | borough | building_number | street | city | state | zip | longitude | latitude | street_2 | description | unit_type | unit | |
|---|---|---|---|---|---|---|---|---|---|---|---|---|---|---|---|---|---|---|
| 0 | 16005-2019-ENFO | 05439358 | STAY FRESH DELI & GRILL CORP. | 2019-03-14T00:00:00.000 | Violation Issued | Grocery-Retail - 808 | Brooklyn | 1695A | BROADWAY | BROOKLYN | NY | 11207 | -73.91210318943877 | 40.68385099919841 | NaN | NaN | NaN | NaN |
| 1 | 62345-2018-ENFO | 03090119 | DOWNTOWN BRONX DELI CORP. | 2018-12-07T00:00:00.000 | Pass | Grocery-Retail - 808 | Bronx | 622 | MELROSE AVE | BRONX | NY | 10455 | -73.91695529015703 | 40.81784221938955 | NaN | NaN | NaN | NaN |
| 2 | 2078462-DCA | 09444093 | JZ CLEANERS 2 INC | 2018-12-10T00:00:00.000 | Warning | Laundries | Manhattan | 365 | E 62ND ST | NEW YORK | NY | 10065 | -73.96127770301152 | 40.761782524350295 | NaN | NaN | NaN | NaN |
| 3 | 34915-2017-ENFO | 09378505 | UWAGBA, JOSEPH OMONIYI | 2017-05-26T00:00:00.000 | No Violation Issued | Electronic Store - 001 | Queens | 11207 | ROCKAWAY BLVD | SOUTH OZONE PARK | NY | 11420 | -73.82603709723433 | 40.67725892415857 | NaN | NaN | NaN | NaN |
| 4 | 60128-2018-ENFO | 50101072 | ROSARIO BROTHERS DELI GROCERY CORP. | 2018-12-06T00:00:00.000 | No Violation Issued | Tobacco Retail Dealer | Bronx | 1082 | OLMSTEAD AVE | BRONX | NY | 10472 | -73.85350721590417 | 40.829037908183906 | NaN | NaN | NaN | NaN |
Data Preparation
There was some heavy amount of preparation that needed to be performed before I could perform any analysis. In addition to the volume of records (196,342 rows by 18 columns with 3,534,156 data points), there were numerous steps needed to ensure that the data was workable. With this dataset, the fact that I was familiar with the business aided in the preparation.
Elimination of Unneeded Columns
- Round one of dropped columns consisted of columns with mostly null values. The dropped columns included street2, description, unit type and unit.
- Round two consisted of data that was unused for this project. They were dropped to decrease the amount of data being processed. These were mostly address specifics that were unneeded for this analysis. This included certificate number, building number, street, city, state, zip. These were unneeded because we have latitude and longitude points for exact address location and the borough field which we would use for analysis.
Dealing with NAs
- All rows with NA values were removed from the data set. 2869 rows were dropped which accounted for 1.46% of the entire original dataset
Data type conversions
- The inspection date field was converted to datetime format for analyzing.
- Latitude and longitude were converted to floats, so they can be properly read into the mapping program.
New columns
- New columns based on the inspection date field were created. This included yr-mon (for visualization), year, month, and weekday (day of the week).
- The data has 22 categories of Inspection Results, the majority of which are not considered violations. In order to properly categorize and analyze a violation vs a non-violation I created an additional column named “violation” based on the Inspection Result field. An Inspection Result of “Violation Issued”, “Confiscated” or “License Confiscated” would be labeled “Violation Issued” in the violation column. All other results would be labeled “No Violation Issued”.
Renaming/Recategorizing
- The data also has 86 categories of Industry which also needed some updating. Due to changes to NYC and NYS laws, there have been some license category changes since 2017 which has resulted in the renaming of some of the license categories. The old inspection records still list the old industry names. These names were updated to merge duplicate categories. “Cigarette Retail Dealer” is now “Tobacco Retail Dealer”, “Laundry” and “Laundry Jobber” are now one license called “Laundries”.
- Due to data entry errors, some borough names were entered in all caps and were counted as their own unique value. The spelling of the all caps versions were changed so that only the first letter was capitalized.
This final preparation resulted in a new set of 193,473 rows and 13 columns with 2,515,149 data points.
********************************************************************************
You had 196342 with 18 columns and 3534156 datapoints.
You now have 193473 rows and 13 columns. Total data points is 2515149
You dropped 2869 rows
********************************************************************************
| record_id | business_name | inspection_date | inspection_result | industry | borough | longitude | latitude | yrmon | year | month | weekday | violation | |
|---|---|---|---|---|---|---|---|---|---|---|---|---|---|
| 0 | 16005-2019-ENFO | STAY FRESH DELI & GRILL CORP. | 2019-03-14 | Violation Issued | Grocery-Retail - 808 | Brooklyn | -73.912103 | 40.683851 | 2019-03 | 2019 | 3 | Thursday | Violation Issued |
| 1 | 62345-2018-ENFO | DOWNTOWN BRONX DELI CORP. | 2018-12-07 | Pass | Grocery-Retail - 808 | Bronx | -73.916955 | 40.817842 | 2018-12 | 2018 | 12 | Friday | No Violation |
| 2 | 2078462-DCA | JZ CLEANERS 2 INC | 2018-12-10 | Warning | Laundries | Manhattan | -73.961278 | 40.761783 | 2018-12 | 2018 | 12 | Monday | No Violation |
| 3 | 34915-2017-ENFO | UWAGBA, JOSEPH OMONIYI | 2017-05-26 | No Violation Issued | Electronic Store - 001 | Queens | -73.826037 | 40.677259 | 2017-05 | 2017 | 5 | Friday | No Violation |
| 4 | 60128-2018-ENFO | ROSARIO BROTHERS DELI GROCERY CORP. | 2018-12-06 | No Violation Issued | Tobacco Retail Dealer | Bronx | -73.853507 | 40.829038 | 2018-12 | 2018 | 12 | Thursday | No Violation |
Lists for Reporting
Inspections Summaries
Next I created a function to convert the data into category summarizations. This takes the data from the dataframe and converts it into list. For each column of the dataframe, a category is created. For each of these categories the data was grouped and list of unique entries with a count an percentage was printed out in descending order.
# print summary of files read
print("*"*80)
print ("Read", len(inspectionList), "inspection data")
print("*"*80)

# all the fields except for the 'name' field
fieldnames = ['InspecResult', 'Industry','weekday', 'borough', 'year','violation']

for fieldname in fieldnames:
    category_summarization(inspectionList, fieldname)
    print()
    print("*"*80)
********************************************************************************
Read 193473 inspection data
********************************************************************************
Number of categories 22
Field InspecResult with Category No Violation Issued and has 70563 entries for 36.47%
Field InspecResult with Category Violation Issued and has 40861 entries for 21.12%
Field InspecResult with Category Pass and has 33474 entries for 17.30%
Field InspecResult with Category Out of Business and has 23196 entries for 11.99%
Field InspecResult with Category Warning and has 7869 entries for 4.07%
Field InspecResult with Category No Evidence of Activity and has 7809 entries for 4.04%
Field InspecResult with Category Closed and has 3196 entries for 1.65%
Field InspecResult with Category No Warning Issued and has 2719 entries for 1.41%
Field InspecResult with Category Fail and has 2144 entries for 1.11%
Field InspecResult with Category Unable to Locate and has 904 entries for 0.47%
Field InspecResult with Category NOH Withdrawn and has 254 entries for 0.13%
Field InspecResult with Category Re-inspection and has 171 entries for 0.09%
Field InspecResult with Category Licensed and has 125 entries for 0.06%
Field InspecResult with Category Unable to Complete Inspection and has 51 entries for 0.03%
Field InspecResult with Category Posting Order Served and has 41 entries for 0.02%
Field InspecResult with Category Business Padlocked and has 39 entries for 0.02%
Field InspecResult with Category Samples Obtained and has 22 entries for 0.01%
Field InspecResult with Category Condemned and has 14 entries for 0.01%
Field InspecResult with Category Completed and has 12 entries for 0.01%
Field InspecResult with Category License Confiscated and has 7 entries for 0.00%
Field InspecResult with Category ECB Summons Issued and has 1 entries for 0.00%
Field InspecResult with Category Unable to Seize Vehicle and has 1 entries for 0.00%

********************************************************************************
Number of categories 85
Field Industry with Category Tobacco Retail Dealer and has 50371 entries for 26.04%
Field Industry with Category Grocery-Retail - 808 and has 31213 entries for 16.13%
Field Industry with Category Misc Non-Food Retail - 817 and has 18136 entries for 9.37%
Field Industry with Category Salons And Barbershop - 841 and has 10781 entries for 5.57%
Field Industry with Category Laundries and has 10735 entries for 5.55%
Field Industry with Category Secondhand Dealer [General] - 006 and has 8559 entries for 4.42%
Field Industry with Category Electronic Store - 001 and has 7307 entries for 3.78%
Field Industry with Category Stoop Line Stand - 033 and has 6654 entries for 3.44%
Field Industry with Category Wearing Apparel - 450 and has 4821 entries for 2.49%
Field Industry with Category Drug Store Retail - 810 and has 4623 entries for 2.39%
Field Industry with Category Supermarket - 819 and has 4493 entries for 2.32%
Field Industry with Category Garage - 049 and has 2852 entries for 1.47%
Field Industry with Category Electronic & Home Appliance Service Dealer - 115 and has 2773 entries for 1.43%
Field Industry with Category Gas Station-Retail - 815 and has 2719 entries for 1.41%
Field Industry with Category Tow Truck Company - 124 and has 2554 entries for 1.32%
Field Industry with Category Sidewalk Cafe - 013 and has 2412 entries for 1.25%
Field Industry with Category Secondhand Dealer Auto - 005 and has 2118 entries for 1.09%
Field Industry with Category Fuel Oil Dealer - 814 and has 1744 entries for 0.90%
Field Industry with Category Electronic Cigarette Dealer and has 1655 entries for 0.86%
Field Industry with Category Tax Preparers - 891 and has 1546 entries for 0.80%
Field Industry with Category Pedicab Business - 130 and has 1307 entries for 0.68%
Field Industry with Category Hardware-Retail - 811 and has 1144 entries for 0.59%
Field Industry with Category Furniture Sales - 242 and has 1139 entries for 0.59%
Field Industry with Category Air Condtioning Law - 899 and has 1035 entries for 0.53%
Field Industry with Category Jewelry Store-Retail - 823 and has 998 entries for 0.52%
Field Industry with Category Sightseeing Bus - 078 and has 983 entries for 0.51%
Field Industry with Category Restaurant - 818 and has 895 entries for 0.46%
Field Industry with Category Parking Lot - 050 and has 802 entries for 0.41%
Field Industry with Category Newsstand - 024 and has 777 entries for 0.40%
Field Industry with Category Dealer In Products For The Disabled - 119 and has 764 entries for 0.39%
Field Industry with Category Pawnbroker - 080 and has 735 entries for 0.38%
Field Industry with Category Tenant Screening - 480 and has 555 entries for 0.29%
Field Industry with Category Employment Agency - 034 and has 535 entries for 0.28%
Field Industry with Category Horse Drawn Cab Owner - 087 and has 530 entries for 0.27%
Field Industry with Category Other and has 490 entries for 0.25%
Field Industry with Category Car Wash and has 299 entries for 0.15%
Field Industry with Category Tobacco Prod'T Sales - 890 and has 259 entries for 0.13%
Field Industry with Category Dealer in Products for the Disabled - 119 and has 236 entries for 0.12%
Field Industry with Category Garage & Parking Lot - 098 and has 223 entries for 0.12%
Field Industry with Category Dry Cleaners - 230 and has 189 entries for 0.10%
Field Industry with Category Retail Store - 820 and has 172 entries for 0.09%
Field Industry with Category Immigration Svc Prv - 893 and has 115 entries for 0.06%
Field Industry with Category Megastore - 821 and has 115 entries for 0.06%
Field Industry with Category Funeral Homes - 888 and has 109 entries for 0.06%
Field Industry with Category Special Sale - 102 and has 104 entries for 0.05%
Field Industry with Category Storage Warehouse - 120 and has 89 entries for 0.05%
Field Industry with Category Floor Coverings - 241 and has 87 entries for 0.04%
Field Industry with Category Scrap Metal Processor - 118 and has 84 entries for 0.04%
Field Industry with Category Auto Rental - 213 and has 83 entries for 0.04%
Field Industry with Category Amusement Device (Permanent) - 016 and has 63 entries for 0.03%
Field Industry with Category Gaming Cafe - 129 and has 62 entries for 0.03%
Field Industry with Category Gasoline Truck-Retail - 822 and has 58 entries for 0.03%
Field Industry with Category Pool Or Billiard Room - 046 and has 53 entries for 0.03%
Field Industry with Category Auction House - 128 and has 38 entries for 0.02%
Field Industry with Category Amusement Arcade - 014 and has 32 entries for 0.02%
Field Industry with Category Catering Establishment - 075 and has 31 entries for 0.02%
Field Industry with Category Scale Dealer/Repairer - 107 and has 31 entries for 0.02%
Field Industry with Category Mini-Storage Company - 830 and has 31 entries for 0.02%
Field Industry with Category Gov'T Agency Retail - 824 and has 30 entries for 0.02%
Field Industry with Category Temporary Street Fair Vendor Permit - 111 and has 24 entries for 0.01%
Field Industry with Category Wholesale Food Market - 718 and has 15 entries for 0.01%
Field Industry with Category Travel Agency - 440 and has 11 entries for 0.01%
Field Industry with Category Secondhand Dealer - Firearm - 006A and has 10 entries for 0.01%
Field Industry with Category Pool or Billiard Room - 046 and has 9 entries for 0.00%
Field Industry with Category Commercial Lessor (Bingo/Games Of Chance) - 091 and has 7 entries for 0.00%
Field Industry with Category Bail Bonds and has 6 entries for 0.00%
Field Industry with Category Health Spa - 839 and has 6 entries for 0.00%
Field Industry with Category Games Of Chance - 088 and has 4 entries for 0.00%
Field Industry with Category Spray Paint Sls Mnor - 832 and has 4 entries for 0.00%
Field Industry with Category Amusement Device (Portable) - 018 and has 4 entries for 0.00%
Field Industry with Category Distress Prop Consultants - 247 and has 3 entries for 0.00%
Field Industry with Category Booting Company - 126 and has 3 entries for 0.00%
Field Industry with Category Amusement Device (Temporary) - 090 and has 3 entries for 0.00%
Field Industry with Category Laser Pointer Sales - 834 and has 3 entries for 0.00%
Field Industry with Category Auto Dealership - 212 and has 2 entries for 0.00%
Field Industry with Category Auto Leasing - 211 and has 2 entries for 0.00%
Field Industry with Category Cabaret - 073 and has 1 entries for 0.00%
Field Industry with Category Box Cutter - 831 and has 1 entries for 0.00%
Field Industry with Category Internet Complaints - 443 and has 1 entries for 0.00%
Field Industry with Category Pregnancy Service Center (PSC) and has 1 entries for 0.00%
Field Industry with Category Bingo Game Operator - 089 and has 1 entries for 0.00%
Field Industry with Category Ticket Seller and has 1 entries for 0.00%
Field Industry with Category Debt Collection Agency - 122 and has 1 entries for 0.00%
Field Industry with Category Hotel/Motel - 460 and has 1 entries for 0.00%
Field Industry with Category Process Server (Organization) - 109 and has 1 entries for 0.00%

********************************************************************************
Number of categories 7
Field weekday with Category Wednesday and has 42470 entries for 21.95%
Field weekday with Category Thursday and has 35717 entries for 18.46%
Field weekday with Category Tuesday and has 34389 entries for 17.77%
Field weekday with Category Friday and has 33650 entries for 17.39%
Field weekday with Category Monday and has 33209 entries for 17.16%
Field weekday with Category Saturday and has 8687 entries for 4.49%
Field weekday with Category Sunday and has 5351 entries for 2.77%

********************************************************************************
Number of categories 6
Field borough with Category Brooklyn and has 58580 entries for 30.28%
Field borough with Category Manhattan and has 49473 entries for 25.57%
Field borough with Category Queens and has 46164 entries for 23.86%
Field borough with Category Bronx and has 31474 entries for 16.27%
Field borough with Category Staten Island and has 7781 entries for 4.02%
Field borough with Category Outside NYC and has 1 entries for 0.00%

********************************************************************************
Number of categories 3
Field year with Category 2017 and has 80206 entries for 41.46%
Field year with Category 2018 and has 70699 entries for 36.54%
Field year with Category 2019 and has 42568 entries for 22.00%

********************************************************************************
Number of categories 2
Field violation with Category No Violation and has 152605 entries for 78.88%
Field violation with Category Violation Issued and has 40868 entries for 21.12%

********************************************************************************
Violations Summaries
I also created a seperate "violations" dataframe which contained all inspections with a violation entry of "Violation Issued". The same function used for the inspections summaries was applied to the violations set.
# print summary of files read
print("*"*80)
print ("Read", len(violationList), "violation data")
print("*"*80)

# all the fields except for the 'name' field
fieldnames = ['Industry','weekday', 'borough', 'year','violation']

for fieldname in fieldnames:
    violation_summarization(violationList, fieldname)
    print()
    print("*"*80)
********************************************************************************
Read 40868 violation data
********************************************************************************
Number of categories 58
Field Industry with Category Grocery-Retail - 808 and has 9007 entries for 22.04%
Field Industry with Category Tobacco Retail Dealer and has 8967 entries for 21.94%
Field Industry with Category Misc Non-Food Retail - 817 and has 2703 entries for 6.61%
Field Industry with Category Laundries and has 2526 entries for 6.18%
Field Industry with Category Stoop Line Stand - 033 and has 2272 entries for 5.56%
Field Industry with Category Drug Store Retail - 810 and has 1786 entries for 4.37%
Field Industry with Category Supermarket - 819 and has 1776 entries for 4.35%
Field Industry with Category Salons And Barbershop - 841 and has 1735 entries for 4.25%
Field Industry with Category Garage - 049 and has 1178 entries for 2.88%
Field Industry with Category Electronic Store - 001 and has 1106 entries for 2.71%
Field Industry with Category Secondhand Dealer [General] - 006 and has 1104 entries for 2.70%
Field Industry with Category Secondhand Dealer Auto - 005 and has 803 entries for 1.96%
Field Industry with Category Electronic & Home Appliance Service Dealer - 115 and has 574 entries for 1.40%
Field Industry with Category Sidewalk Cafe - 013 and has 548 entries for 1.34%
Field Industry with Category Tax Preparers - 891 and has 535 entries for 1.31%
Field Industry with Category Electronic Cigarette Dealer and has 526 entries for 1.29%
Field Industry with Category Other and has 480 entries for 1.17%
Field Industry with Category Wearing Apparel - 450 and has 441 entries for 1.08%
Field Industry with Category Gas Station-Retail - 815 and has 306 entries for 0.75%
Field Industry with Category Parking Lot - 050 and has 289 entries for 0.71%
Field Industry with Category Tobacco Prod'T Sales - 890 and has 201 entries for 0.49%
Field Industry with Category Air Condtioning Law - 899 and has 200 entries for 0.49%
Field Industry with Category Newsstand - 024 and has 187 entries for 0.46%
Field Industry with Category Furniture Sales - 242 and has 148 entries for 0.36%
Field Industry with Category Tow Truck Company - 124 and has 131 entries for 0.32%
Field Industry with Category Car Wash and has 131 entries for 0.32%
Field Industry with Category Restaurant - 818 and has 124 entries for 0.30%
Field Industry with Category Pawnbroker - 080 and has 124 entries for 0.30%
Field Industry with Category Hardware-Retail - 811 and has 118 entries for 0.29%
Field Industry with Category Employment Agency - 034 and has 99 entries for 0.24%
Field Industry with Category Special Sale - 102 and has 85 entries for 0.21%
Field Industry with Category Pedicab Business - 130 and has 82 entries for 0.20%
Field Industry with Category Fuel Oil Dealer - 814 and has 73 entries for 0.18%
Field Industry with Category Jewelry Store-Retail - 823 and has 72 entries for 0.18%
Field Industry with Category Tenant Screening - 480 and has 71 entries for 0.17%
Field Industry with Category Garage & Parking Lot - 098 and has 57 entries for 0.14%
Field Industry with Category Megastore - 821 and has 51 entries for 0.12%
Field Industry with Category Immigration Svc Prv - 893 and has 47 entries for 0.12%
Field Industry with Category Dealer In Products For The Disabled - 119 and has 44 entries for 0.11%
Field Industry with Category Dry Cleaners - 230 and has 42 entries for 0.10%
Field Industry with Category Gaming Cafe - 129 and has 30 entries for 0.07%
Field Industry with Category Retail Store - 820 and has 15 entries for 0.04%
Field Industry with Category Amusement Arcade - 014 and has 12 entries for 0.03%
Field Industry with Category Sightseeing Bus - 078 and has 9 entries for 0.02%
Field Industry with Category Floor Coverings - 241 and has 9 entries for 0.02%
Field Industry with Category Storage Warehouse - 120 and has 9 entries for 0.02%
Field Industry with Category Pool Or Billiard Room - 046 and has 8 entries for 0.02%
Field Industry with Category Auto Rental - 213 and has 7 entries for 0.02%
Field Industry with Category Bail Bonds and has 4 entries for 0.01%
Field Industry with Category Scrap Metal Processor - 118 and has 4 entries for 0.01%
Field Industry with Category Mini-Storage Company - 830 and has 3 entries for 0.01%
Field Industry with Category Temporary Street Fair Vendor Permit - 111 and has 3 entries for 0.01%
Field Industry with Category Scale Dealer/Repairer - 107 and has 1 entries for 0.00%
Field Industry with Category Auction House - 128 and has 1 entries for 0.00%
Field Industry with Category Wholesale Food Market - 718 and has 1 entries for 0.00%
Field Industry with Category Gasoline Truck-Retail - 822 and has 1 entries for 0.00%
Field Industry with Category Catering Establishment - 075 and has 1 entries for 0.00%
Field Industry with Category Funeral Homes - 888 and has 1 entries for 0.00%

********************************************************************************
Number of categories 7
Field weekday with Category Wednesday and has 9179 entries for 22.46%
Field weekday with Category Thursday and has 7841 entries for 19.19%
Field weekday with Category Friday and has 7092 entries for 17.35%
Field weekday with Category Tuesday and has 7051 entries for 17.25%
Field weekday with Category Monday and has 6902 entries for 16.89%
Field weekday with Category Saturday and has 1774 entries for 4.34%
Field weekday with Category Sunday and has 1029 entries for 2.52%

********************************************************************************
Number of categories 5
Field borough with Category Brooklyn and has 14112 entries for 34.53%
Field borough with Category Manhattan and has 10390 entries for 25.42%
Field borough with Category Queens and has 8628 entries for 21.11%
Field borough with Category Bronx and has 6147 entries for 15.04%
Field borough with Category Staten Island and has 1591 entries for 3.89%

********************************************************************************
Number of categories 3
Field year with Category 2017 and has 16650 entries for 40.74%
Field year with Category 2018 and has 14253 entries for 34.88%
Field year with Category 2019 and has 9965 entries for 24.38%

********************************************************************************
Number of categories 1
Field violation with Category Violation Issued and has 40868 entries for 100.00%

********************************************************************************
Top 10 Industries and Inspection Results
Because there was such a large number of industries as well as inspection results, I created a top 10 list of both for the inspections as well as violations sets.
********************************************************************************
Top 10 Industry types (Inspection set)
********************************************************************************
Tobacco Retail Dealer                50371
Grocery-Retail - 808                 31213
Misc Non-Food Retail - 817           18136
Salons And Barbershop - 841          10781
Laundries                            10735
Secondhand Dealer [General] - 006     8559
Electronic Store - 001                7307
Stoop Line Stand - 033                6654
Wearing Apparel - 450                 4821
Drug Store Retail - 810               4623
Name: industry, dtype: int64
********************************************************************************


********************************************************************************
Top 10 Industry types (Violation set)
********************************************************************************
Grocery-Retail - 808           9007
Tobacco Retail Dealer          8967
Misc Non-Food Retail - 817     2703
Laundries                      2526
Stoop Line Stand - 033         2272
Drug Store Retail - 810        1786
Supermarket - 819              1776
Salons And Barbershop - 841    1735
Garage - 049                   1178
Electronic Store - 001         1106
Name: industry, dtype: int64
********************************************************************************


********************************************************************************
Top 10 Inspection Results
********************************************************************************
No Violation Issued        70563
Violation Issued           40861
Pass                       33474
Out of Business            23196
Warning                     7869
No Evidence of Activity     7809
Closed                      3196
No Warning Issued           2719
Fail                        2144
Unable to Locate             904
Name: inspection_result, dtype: int64
********************************************************************************
Visualizations
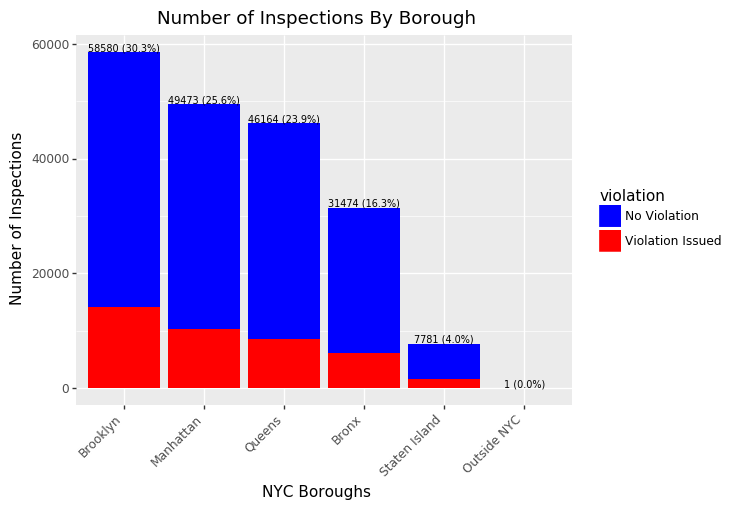
Inspections By Borough
#####-----     Plot Inspections by Borough     -----#####
# Borough counts
boros = np.array(['Bronx','Brooklyn', 'Manhattan', 'Outside NYC', 'Queens', 'Staten Island'])
boroughset = inspections_df.filter(['record_id','borough','violation'], axis=1)
boroughcounts = boroughset.groupby(['borough','violation']).count()

# Count totals
boroughtotal = boroughcounts.sum(level=0)
boroughcounts = boroughcounts.unstack(level=1)
boroughcounts.columns = boroughcounts.columns.droplevel(level=0)
boroughcounts = boroughcounts.fillna(0)
boroughcounts.sort_values(by=['No Violation'])

# Print Summary
print("*"*80)
print (boroughcounts)
print("*"*80)

# Sorting
borough_list = inspections_df['borough'].value_counts().index.tolist()
borough_cat = pd.Categorical(inspections_df['borough'], categories=borough_list)

# assign to a new column in the DataFrame
inspections_df = inspections_df.assign(borough_cat = borough_cat)

# combine the counts and percentages
def combine(counts, percentages):
    fmt = '{} ({:.1f}%)'.format
    return [fmt(c, p) for c, p in zip(counts, percentages)]

# Plot Bar graph
g = (ggplot(inspections_df, aes('factor(borough_cat)', fill='violation'))         # defining what data to use
 + aes(x= 'borough_cat')    # defining what variable to use
 + geom_bar(size=100) # defining the type of plot to use
 + theme(axis_text_x = element_text(angle = 45, hjust = 1))
 + geom_text(
     aes(label='stat(combine(count, 100*prop))', group=1),
     stat='count', nudge_y=0.125, size=7, va='bottom')
 + labs(title='Number of Inspections By Borough', x='NYC Boroughs', y='Number of Inspections') # customizing labels
 + scale_fill_manual(values = ("Blue","Red"))
)
g.draw()
********************************************************************************
violation      No Violation  Violation Issued
borough
Bronx               25327.0            6147.0
Brooklyn            44468.0           14112.0
Manhattan           39083.0           10390.0
Outside NYC             1.0               0.0
Queens              37536.0            8628.0
Staten Island        6190.0            1591.0
********************************************************************************
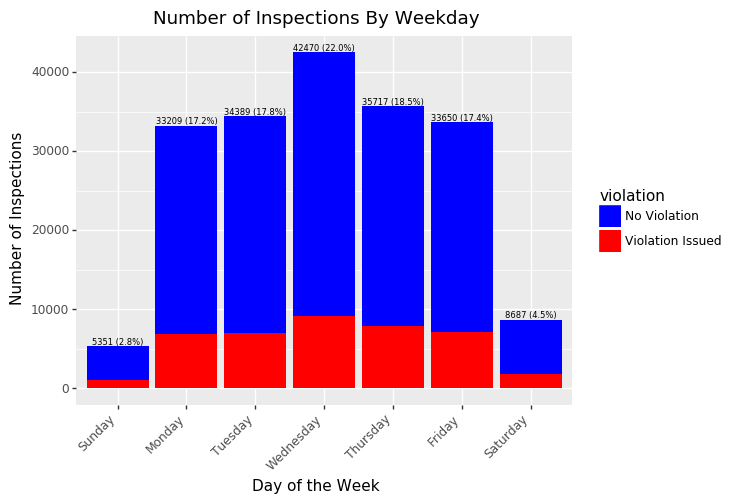
Inspections By Day of the Week
#####-----     Plot Inspections by Day of of the week   -----#####
# Weekday counts
weekdays = np.array(['Sunday','Monday', 'Tuesday', 'Wednesday', 'Thursday', 'Friday', 'Saturday'])
weekset = inspections_df.filter(['record_id','weekday','violation'], axis=1)
weekcounts = weekset.groupby(['weekday','violation']).count()

# Count totals
weektotal = weekcounts.sum(level=0)
weekcounts = weekcounts.unstack(level=1)
weekcounts.columns = weekcounts.columns.droplevel(level=0)
weekcounts = weekcounts.fillna(0)
weekcounts.sort_values(by=['No Violation'])

# Print Summary
print("*"*80)
print (weekcounts)
print("*"*80)

# Make Day of the Week Ordered Categorical
inspections_df['weekday'] = pd.Categorical(inspections_df['weekday'], categories=
['Sunday','Monday','Tuesday','Wednesday','Thursday','Friday','Saturday'],
ordered=True)

# Plot Bar graph
g = (ggplot(inspections_df, aes('factor(weekday)', fill='violation'))         # defining what data to use
 + aes(x= 'weekday')    # defining what variable to use
 + geom_bar(size=100) # defining the type of plot to use
 + theme(axis_text_x = element_text(angle = 45, hjust = 1))
 + geom_text(
     aes(label='stat(combine(count, 100*prop))', group=1),
     stat='count', nudge_y=0.125, size=6, va='bottom')
 + labs(title='Number of Inspections By Weekday', x='Day of the Week', y='Number of Inspections')
 + scale_fill_manual(values = ("Blue","Red"))
)
g.draw()
********************************************************************************
violation  No Violation  Violation Issued
weekday
Friday            26558              7092
Monday            26307              6902
Saturday           6913              1774
Sunday             4322              1029
Thursday          27876              7841
Tuesday           27338              7051
Wednesday         33291              9179
********************************************************************************
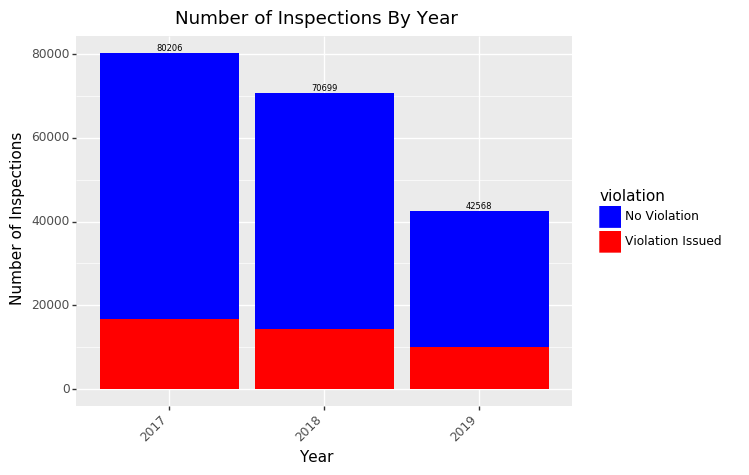
Inspections By Year
#####-----     Plot Inspections by Year  -----#####
# Year counts
years = np.array(['2017','2018', '2019'])
yearset = inspections_df.filter(['record_id','year','violation'], axis=1)
yearcounts = yearset.groupby(['year','violation']).count()

# Count totals
yeartotal = yearcounts.sum(level=0)
yearcounts = yearcounts.unstack(level=1)
yearcounts.columns = yearcounts.columns.droplevel(level=0)
yearcounts = yearcounts.fillna(0)
yearcounts.sort_values(by=['No Violation'])

# Print Summary
print("*"*80)
print (yearcounts)
print("*"*80)

# Plot Bar graph
g= (ggplot(inspections_df, aes('factor(year)', fill='violation'))         # defining what data to use
 + aes(x= 'year')    # defining what variable to use
 + geom_bar(size=100) # defining the type of plot to use
 + theme(axis_text_x = element_text(angle = 45, hjust = 1))
 + geom_text(
     aes(label='stat(count)', group=1),
     stat='count', nudge_y=0.125, size=6, va='bottom')
 + labs(title='Number of Inspections By Year', x='Year', y='Number of Inspections') # customizing labels
 + scale_fill_manual(values = ("Blue","Red"))
)
g.draw()
********************************************************************************
violation  No Violation  Violation Issued
year
2017              63556             16650
2018              56446             14253
2019              32603              9965
********************************************************************************
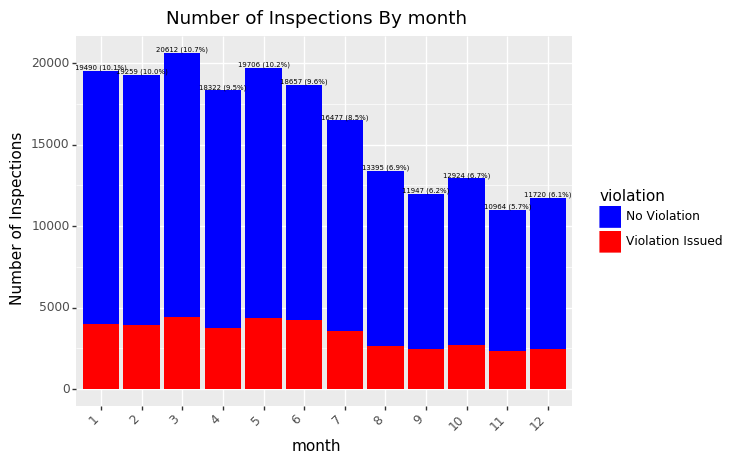
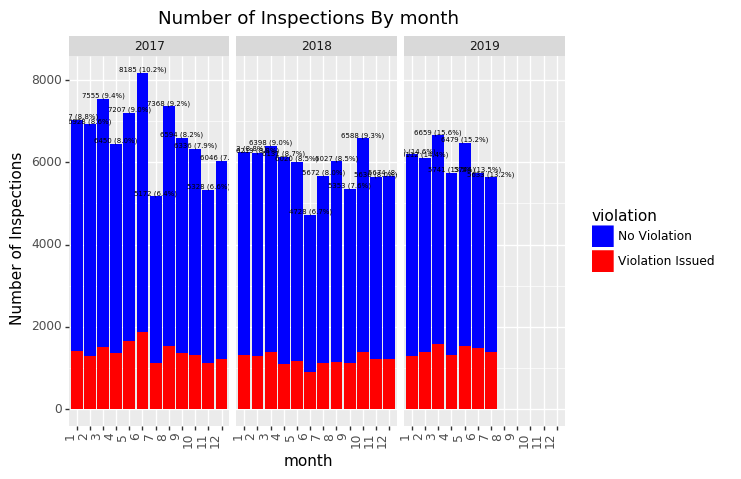
Inspections By Month
#####-----     Plot Inspections by Month  -----#####
# Year counts
months = np.array(['1','2', '3', '4', '5', '6', '7', '8', '9', '10', '11', '12'])
monthset = inspections_df.filter(['record_id','month','violation'], axis=1)
monthcounts = monthset.groupby(['month','violation']).count()

# Count totals
monthtotal = monthcounts.sum(level=0)
monthcounts = monthcounts.unstack(level=1)
monthcounts.columns = monthcounts.columns.droplevel(level=0)
monthcounts = monthcounts.fillna(0)
monthcounts.sort_values(by=['No Violation'])

# Print Summary
print("*"*80)
print (monthcounts)
print("*"*80)

g = (ggplot(inspections_df, aes('factor(month)', fill='violation'))         # defining what data to use
 + aes(x= 'month')    # defining what variable to use
 + geom_bar(size=50) # defining the type of plot to use
 + theme(axis_text_x = element_text(angle = 45, hjust = 1))
 + geom_text( aes(label='stat(combine(count, 100*prop))', group=1),
     stat='count', nudge_y=0.125, size=5, va='bottom')
 + labs(title='Number of Inspections By month', x='month', y='Number of Inspections') # customizing labels
 + scale_fill_manual(values = ("Blue","Red"))
)
g.draw()
********************************************************************************
violation  No Violation  Violation Issued
month
1                 15501              3989
2                 15317              3942
3                 16175              4437
4                 14571              3751
5                 15346              4360
6                 14411              4246
7                 12886              3591
8                 10729              2666
9                  9488              2459
10                10240              2684
11                 8649              2315
12                 9292              2428
********************************************************************************
Inspections By Year/Month
 #####-----     Plot Inspections by Month for each Year -----#####
g = (ggplot(inspections_df, aes('factor(month)', fill='violation'))         # defining what data to use
 + aes(x= 'month')    # defining what variable to use
 + geom_bar(size=50) # defining the type of plot to use
 + facet_wrap("year")
 + theme(axis_text_x = element_text(angle = 90, hjust = 1))
 + geom_text( aes(label='stat(combine(count, 100*prop))', group=1),
     stat='count', nudge_y=0.125, size=5, va='bottom')
 + labs(title='Number of Inspections By month', x='month', y='Number of Inspections') # customizing labels
+ scale_fill_manual(values = ("Blue","Red"))
)
g.draw()
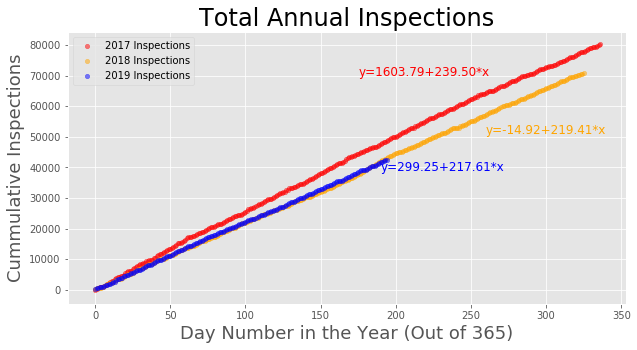
Total Annual Inspections
# Daily comparison per year
#Select the columns we want
dailygroup = inspections_df[['inspection_date', 'borough', 'yrmon', 'year', 'month', 'weekday', 'violation']]
dailygroup['month']=dailygroup.month.astype('int64')

dailygroup['DATE_OF_INSPECTION'] = dailygroup['inspection_date']
dailygroup=dailygroup.set_index('DATE_OF_INSPECTION')
dailygroup = dailygroup.sort_index()
# Create group DFs for each year grouped by date
dailygroup['daily_sum'] = 1
group2018= dailygroup.groupby(dailygroup.index)
df_2018=pd.DataFrame(group2018['daily_sum'].sum())
df_2018['cum_sum'] = df_2018.daily_sum.cumsum()
df_2018['day'] = range(len(df_2018))

group_inspection=dailygroup.groupby(['year'])

df2019=group_inspection.get_group(2019)
group2019= df2019.groupby(df2019.index)
df_2019=pd.DataFrame(group2019['daily_sum'].sum())
df_2019['cum_sum'] = df_2019.daily_sum.cumsum()
df_2019['day'] = range(len(df_2019))
df_2019.insert(3, 'year', '2019')
print(df_2019)

df2018=group_inspection.get_group(2018)
group2018= df2018.groupby(df2018.index)
df_2018=pd.DataFrame(group2018['daily_sum'].sum())
df_2018['cum_sum'] = df_2018.daily_sum.cumsum()
df_2018['day'] = range(len(df_2018))
df_2018.insert(3, 'year', '2018')
print(df_2018)

df2017=group_inspection.get_group(2017)
group2017= df2017.groupby(df2017.index)
df_2017=pd.DataFrame(group2017['daily_sum'].sum())
df_2017['cum_sum'] = df_2017.daily_sum.cumsum()
df_2017['day'] = range(len(df_2017))
df_2017.insert(3, 'year', '2017')
print(df_2017)
                    daily_sum  cum_sum  day  year
DATE_OF_INSPECTION
2019-01-02                283      283    0  2019
2019-01-03                239      522    1  2019
2019-01-04                215      737    2  2019
2019-01-05                 81      818    3  2019
2019-01-06                 77      895    4  2019
...                       ...      ...  ...   ...
2019-07-25                288    41714  190  2019
2019-07-26                158    41872  191  2019
2019-07-29                263    42135  192  2019
2019-07-30                278    42413  193  2019
2019-07-31                155    42568  194  2019

[195 rows x 4 columns]
                    daily_sum  cum_sum  day  year
DATE_OF_INSPECTION
2018-01-02                178      178    0  2018
2018-01-03                293      471    1  2018
2018-01-04                 11      482    2  2018
2018-01-06                 81      563    3  2018
2018-01-07                 60      623    4  2018
...                       ...      ...  ...   ...
2018-12-26                247    70045  321  2018
2018-12-27                262    70307  322  2018
2018-12-28                180    70487  323  2018
2018-12-29                 76    70563  324  2018
2018-12-31                136    70699  325  2018

[326 rows x 4 columns]
                    daily_sum  cum_sum  day  year
DATE_OF_INSPECTION
2017-01-02                  1        1    0  2017
2017-01-03                107      108    1  2017
2017-01-04                331      439    2  2017
2017-01-05                320      759    3  2017
2017-01-07                132      891    4  2017
...                       ...      ...  ...   ...
2017-12-25                  1    79210  332  2017
2017-12-26                232    79442  333  2017
2017-12-27                285    79727  334  2017
2017-12-28                244    79971  335  2017
2017-12-29                235    80206  336  2017

[337 rows x 4 columns]
# Creating Plot of Total Inspections in the Year (Using matplotlib.pyplot)

# Scatter plots.
ax1= df_2017.plot(kind='scatter', x='day',y='cum_sum', color='red',alpha=0.5, figsize=(10,5))
df_2018.plot(kind='scatter', x='day',y='cum_sum', color='orange',alpha=0.5, figsize=(10,5),ax=ax1)
df_2019.plot(kind='scatter', x='day',y='cum_sum', color='blue',alpha=0.5, figsize=(10,5),ax=ax1)

#Best fit polynomials for regression lines
df2017_fit = np.polyfit(df_2017.day,df_2017.cum_sum,1) #[ 239.50123034 1603.79033589]
df2018_fit = np.polyfit(df_2018.day,df_2018.cum_sum,1) #[219.41454971 -14.92260933]
df2019_fit = np.polyfit(df_2019.day,df_2019.cum_sum,1) #[217.60771658 299.24636316]

# Regression equations.
plt.text(175,70000,'y={:.2f}+{:.2f}*x'.format(df2017_fit[1],df2017_fit[0]),color='red',size=12)
plt.text(260,51000,'y={:.2f}+{:.2f}*x'.format(df2018_fit[1],df2018_fit[0]),color='orange',size=12)
plt.text(190,39000,'y={:.2f}+{:.2f}*x'.format(df2019_fit[1],df2019_fit[0]),color='blue',size=12)

# Legend, title and labels.
plt.legend(labels=['2017 Inspections','2018 Inspections', '2019 Inspections'])
plt.title('Total Annual Inspections', size=24)
plt.xlabel('Day Number in the Year (Out of 365)', size=18)
plt.ylabel('Cummulative Inspections', size=18);
plt.show()
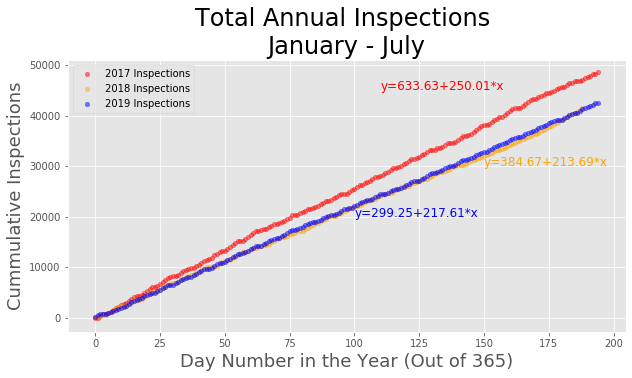
#YTD Graph Up until end of august
YTDgroup = inspections_df[['inspection_date', 'borough', 'yrmon', 'year', 'month', 'weekday', 'violation']]
YTDgroup['month']=YTDgroup.month.astype('int64')
YTDgroup = YTDgroup[YTDgroup['month']<8]

YTDgroup['DATE_OF_INSPECTION'] = YTDgroup['inspection_date']
YTDgroup=YTDgroup.set_index('DATE_OF_INSPECTION')
YTDgroup = YTDgroup.sort_index()


# Create group DFs
YTDgroup['daily_sum'] = 1
group2018= YTDgroup.groupby(YTDgroup.index)
YTD2018=pd.DataFrame(group2018['daily_sum'].sum())
YTD2018['cum_sum'] = YTD2018.daily_sum.cumsum()
YTD2018['day'] = range(len(YTD2018))

group_inspection=YTDgroup.groupby(['year'])

df2019=group_inspection.get_group(2019)
group2019= df2019.groupby(df2019.index)
YTD2019=pd.DataFrame(group2019['daily_sum'].sum())
YTD2019['cum_sum'] = YTD2019.daily_sum.cumsum()
YTD2019['day'] = range(len(YTD2019))
YTD2019.insert(3, 'year', '2019')
print(YTD2019)
print("*"*80)

df2018=group_inspection.get_group(2018)
group2018= df2018.groupby(df2018.index)
YTD2018=pd.DataFrame(group2018['daily_sum'].sum())
YTD2018['cum_sum'] = YTD2018.daily_sum.cumsum()
YTD2018['day'] = range(len(YTD2018))
YTD2018.insert(3, 'year', '2018')
print(YTD2018)
print("*"*80)

df2017=group_inspection.get_group(2017)
group2017= df2017.groupby(df2017.index)
YTD2017=pd.DataFrame(group2017['daily_sum'].sum())
YTD2017['cum_sum'] = YTD2017.daily_sum.cumsum()
YTD2017['day'] = range(len(YTD2017))
YTD2017.insert(3, 'year', '2017')
print(YTD2017)
print("*"*80)
                    daily_sum  cum_sum  day  year
DATE_OF_INSPECTION
2019-01-02                283      283    0  2019
2019-01-03                239      522    1  2019
2019-01-04                215      737    2  2019
2019-01-05                 81      818    3  2019
2019-01-06                 77      895    4  2019
...                       ...      ...  ...   ...
2019-07-25                288    41714  190  2019
2019-07-26                158    41872  191  2019
2019-07-29                263    42135  192  2019
2019-07-30                278    42413  193  2019
2019-07-31                155    42568  194  2019

[195 rows x 4 columns]
********************************************************************************
                    daily_sum  cum_sum  day  year
DATE_OF_INSPECTION
2018-01-02                178      178    0  2018
2018-01-03                293      471    1  2018
2018-01-04                 11      482    2  2018
2018-01-06                 81      563    3  2018
2018-01-07                 60      623    4  2018
...                       ...      ...  ...   ...
2018-07-25                280    40307  184  2018
2018-07-26                265    40572  185  2018
2018-07-27                191    40763  186  2018
2018-07-30                332    41095  187  2018
2018-07-31                326    41421  188  2018

[189 rows x 4 columns]
********************************************************************************
                    daily_sum  cum_sum  day  year
DATE_OF_INSPECTION
2017-01-02                  1        1    0  2017
2017-01-03                107      108    1  2017
2017-01-04                331      439    2  2017
2017-01-05                320      759    3  2017
2017-01-07                132      891    4  2017
...                       ...      ...  ...   ...
2017-07-26                200    47556  190  2017
2017-07-27                305    47861  191  2017
2017-07-28                365    48226  192  2017
2017-07-29                  2    48228  193  2017
2017-07-31                306    48534  194  2017

[195 rows x 4 columns]
********************************************************************************
Total Annual Inspections (YTD)
# Creating Plot of Total Inspections in the Year

# Scatter plots.
ax1= YTD2017.plot(kind='scatter', x='day',y='cum_sum', color='red',alpha=0.5, figsize=(10,5))
YTD2018.plot(kind='scatter', x='day',y='cum_sum', color='orange',alpha=0.5, figsize=(10,5),ax=ax1)
YTD2019.plot(kind='scatter', x='day',y='cum_sum', color='blue',alpha=0.5, figsize=(10,5),ax=ax1)

#Best fit polynomials for regression lines
YTD2017_fit = np.polyfit(YTD2017.day,YTD2017.cum_sum,1) #[248.54346118 733.58163837]
YTD2018_fit = np.polyfit(YTD2018.day,YTD2018.cum_sum,1) #[217.31322235 144.54155999]
YTD2019_fit = np.polyfit(YTD2019.day,YTD2019.cum_sum,1) #[217.60771658 299.24636316]

# Regression equations.
plt.text(110,45000,'y={:.2f}+{:.2f}*x'.format(YTD2017_fit[1],YTD2017_fit[0]),color='red',size=12)
plt.text(150,30000,'y={:.2f}+{:.2f}*x'.format(YTD2018_fit[1],YTD2018_fit[0]),color='orange',size=12)
plt.text(100,20000,'y={:.2f}+{:.2f}*x'.format(YTD2019_fit[1],YTD2019_fit[0]),color='blue',size=12)

# Legend, title and labels.
plt.legend(labels=['2017 Inspections','2018 Inspections', '2019 Inspections'])
plt.title('Total Annual Inspections \nJanuary - July', size=24)
plt.xlabel('Day Number in the Year (Out of 365)', size=18)
plt.ylabel('Cummulative Inspections', size=18);
plt.show()
Conclusion
In conclusion, I did learn some things about the DCA’s inspections. Tobacco Retail Business and Grocery-Retail are the most inspected business types and to no surprise also the largest percentage of businesses in violation. Brooklyn, not Manhattan is the most inspected borough. Some inspections occur on the weekends but the total inspections increase leading up to the busiest day of the week which is Wednesday and then reduce until they are low on the weekends. I also learned that on a monthly basis, the total monthly inspections start strong in the beginning of the year and decrease towards the end of the year (most likely due to vacations and potentially some annual inspections that only occur at the start of a new year). Lastly, although it looked like 2019 was a low performing year it is actually projected to surpass 2018 based on regression analysis. This final conclusion drives home the point that we should really look at the data before making uninformed assumptions. It demonstrates the importance of proper analysis and reporting. While initially we could say, “2019 has a long way to go before it reaches the 2018 numbers”, the data can also make us say, “2019 is projected to surpass 2018 numbers”.
While this was a good basic exploration of the data, there is more that I would want to look into for the future. I would like to see if we could mine this data to make predictions. Are you more likely to get a violation as a Tobacco Business on a Wednesday (Probably Yes)? I really wanted to look at time of day, however that field is not part of this data set. Potentially, there could be some existing patterns with regards to inspections and violations that we are unable to see from this basic exploration of the data.
Tobacco Inspections Map for July 2019
#Mapping Datasets - Tobacco Inspections for July 2019

# Pull Violations Data
violations_df = inspections_df[(inspections_df['inspection_result']=='Violation Issued')]
violations_df = violations_df[(violations_df['industry']=='Tobacco Retail Dealer')]
#violations_df = violations_df[(violations_df['industry']=='Tobacco Retail Dealer') | (violations_df['industry']=='Grocery-Retail')]
violations_df = violations_df[(violations_df['year']==2019) & (violations_df['month']==7)]
#violations_df = violations_df[(violations_df['year']==2019)]
violations_df = violations_df[['latitude', 'longitude','business_name','industry']]
violations_df = violations_df.dropna(axis=0, subset=['latitude','longitude'])

# Pull Inspec Data
nov_df = inspections_df[inspections_df['inspection_result']!='Violation Issued']
nov_df = nov_df[(nov_df['industry']=='Tobacco Retail Dealer')]
#nov_df = nov_df[(nov_df['industry']=='Tobacco Retail Dealer') | (nov_df['industry']=='Grocery-Retail')]
nov_df = nov_df[(nov_df['year']==2019) & (nov_df['month']==7)]
#nov_df = nov_df[(nov_df['year']==2019)]
nov_df = nov_df[['latitude', 'longitude','business_name','industry']]
nov_df = nov_df.dropna(axis=0, subset=['latitude','longitude'])

# NYCmap
nycmap = folium.Map(
    location=[40.713050, -74.007230],
    zoom_start=11)

# Add Violations marker one by one on the map
for i in range(0,len(violations_df)):
    folium.Marker([violations_df.iloc[i]['latitude'],
                   violations_df.iloc[i]['longitude']],
                  popup=(violations_df.iloc[i]['business_name'], violations_df.iloc[i]['industry']),
                  icon=folium.Icon(color='red', icon='remove')
                 ).add_to(nycmap)

# Add Non-Violations marker one by one on the map
for i in range(0,len(nov_df)):
    folium.Marker([nov_df.iloc[i]['latitude'],
                   nov_df.iloc[i]['longitude']],
                  popup=(nov_df.iloc[i]['business_name'], nov_df.iloc[i]['industry']),
                  icon=folium.Icon(color='blue', icon='thumbs-up')
                 ).add_to(nycmap)
********************************************************************************
Generating Tobacco Inspections Map for July 2019
Plotting 231 Violation Tobacco Inspections
Plotting 877 Non-Violation Tobacco inspections
Click individual markers on the map for details
********************************************************************************
output_file = "inspectionsmap.html"
map = nycmap
map.save(output_file)
webbrowser.open(output_file, new=2)
Code
You can check out the full Python code using the following methods:
- Github Page: Francisco’s Repository
- Google Colab:


